Main Content
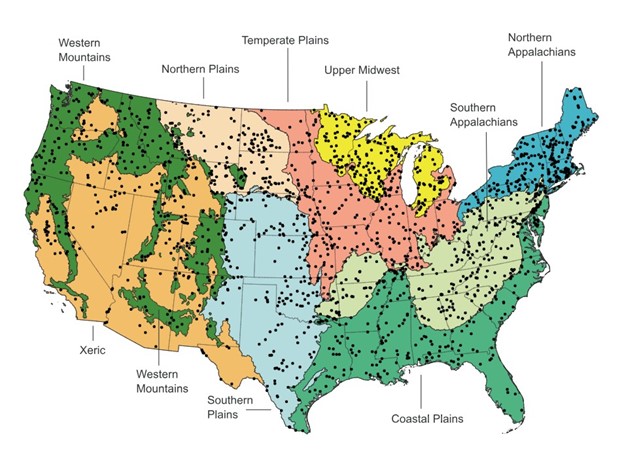
In December 2023, the U.S. Environmental Protection Agency (EPA) released their National Rivers and Streams Assessment (NRSA) report. This report presents the results of the 2018-2019 survey of rivers and streams in the 48 contiguous United States (Figure 1). It provides information on the extent of stream miles that support healthy biological communities and recreation opportunities. Assessments like this, and the data they contain, are the first steps in managing our natural resources by identifying the causes and potential sources of problems in our waters. The 2018-2019 survey is the third one conducted by EPA, with the first conducted in 2008-2009 and a second in 2013-2014.

Figure 1: Map of NRSA 2018-19 sampling sites in each region of the United States. (Taken from: riverstreamassessment.epa.gov/webreport/)
Some highlights from the report include:
- Healthy habitat occurred in over half of our river and stream miles.
- Physical habitat indicator scores revealed that 68% of river and stream miles were rated good for in-stream fish habitat, 57% scored good for streambed sediment levels, and 56% of river and stream miles had good ratings for riparian vegetation (vegetation on or adjacent to the river or stream banks).
- However, 64% of river and stream miles had moderate or high levels of riparian area disturbance.
- Less than one-third of our river and stream miles (28%) had healthy biological communities, based on an analysis of benthic macroinvertebrate communities (bottom-dwelling invertebrates such as dragonfly and stonefly larvae, snails, worms, and beetles).
- Close to half of river and stream miles (47%) were in poor condition.
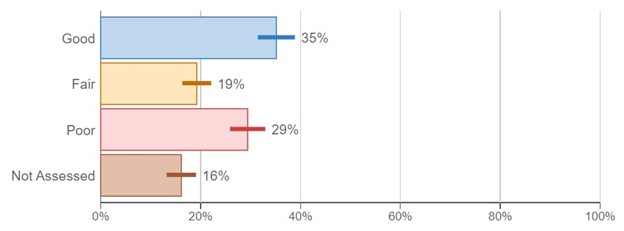
- Just over one-third (35%) of river and stream miles had healthy fish communities (Figure 2).
- Fish community health was based on fish abundance and diversity.
- Sixteen percent of river and stream miles were not assessed for fish. The remainder (49%) were in fair or poor condition.

Figure 2: Percentage of river and stream miles in each Fish Community Condition category nationally. (Taken from: riverstreamassessment.epa.gov/webreport/)
- Nutrients (phosphorus and nitrogen) were the most widespread water quality stressors.
- Forty-two percent (42%) of the nation’s river and stream miles were in poor condition, with elevated levels of phosphorus, and 44% were in poor condition for nitrogen.
- Poor biological condition was more likely seen when rivers and streams were in poor condition for nutrients.
- Reducing nutrient pollution could improve biological condition.
- NRSA analyses indicated that approximately 20% of the river and stream miles in poor biological condition could be improved if nutrient condition changed from poor to fair or good. The level of improvement was estimated to be similar regardless of type of nutrient and biological indicator analyzed.
- Bacteria exceeded EPA’s recreational benchmark in 20% of river and stream miles.
- Enterococci, a type of bacteria that indicate fecal contamination, were above EPA’s benchmark in 20% of river and stream miles.
- Swimming and recreating in water contaminated with pathogens could make people ill.
To view the complete report, please visit riverstreamassessment.epa.gov/webreport/.
How can you find out about local streams & rivers?
The information in the NRSA report is valuable to manage our resources but does not provide state-specific information for those interested in New Jersey’s waters. If you would like to learn more about your local watershed, you can watch the ‘Exploring Your Watershed from Home’ webinar by Dr. Sal Mangiafico from June 2020 where he describes useful online tools to determine local water quality, soil health, and habitats around your house (www.youtube.com/watch?v=vkXHKI7uWDA&list=PLKx8NLAujm_lpOimXWyHxPD613H7HjZKd&index=18). You can also use the EPA’s ‘How’s My Waterway?’ website to find nearby water conditions and what may be protecting or impairing water quality (www.epa.gov/waterdata/hows-my-waterway). This site allows you to enter your address so that you can pinpoint what watershed you are in and what is affecting local water quality.
What can you do to protect or improve water quality?
These are just a few actions that you can take to start the New Year by making Earth Day every day! Additional ideas can be found by browsing the ‘Water’ category of the Earth Day, Every Day Program’s recorded webinars at envirostewards.rutgers.edu/earth-day-every-day/#water.
Get your soil tested – A soil fertility test from the Rutgers Soil Testing Laboratory (njaes.rutgers.edu/soil-testing-lab/) will tell you whether you need to add amendments or nutrients, and the proper amounts of each to add. This valuable information will help prevent excess nutrients in the fertilizers (such as phosphorus and nitrogen) from washing off your yards and into nearby streams and storm drains when it rains or you water your lawns. You can pair your soil test with a Certified Professional Fertilizer Applicator from Rutgers ProFACT Program (profact.rutgers.edu/) to ensure that the right amount of nutrients remain in your yard and do not go down the drain.
Go native with your plant selection – Native species of plants are acclimated to local weather and soil conditions, requiring less water and soil amendments than non-native vegetation. A great place to get ideas for native plants is the Jersey-Friendly Yards Plant Database (www.jerseyyards.org/plant/), where you can create customized plant lists for your landscape after entering your yard’s soil, light requirements (shady or sunny), whether you wish to attract wildlife, and other information. You can also contact your local Rutgers Cooperative Extension (RCE) office (njaes.rutgers.edu/county/) to help with your home horticulture needs through either its experienced staff or its certified Rutgers Master Gardeners.
Don’t let streams go to waste – Pet and other animal waste can carry bacteria that is harmful to people if exposed to them through swimming or getting splashed during a canoe or kayak trip. These pathogenic (disease-causing) bacteria can be kept out of our streams and rivers by picking up after your dog when out on a walk and properly disposing of the waste, limiting deer on your property with deer-resistant landscape plants, and managing Canada geese by reducing the amount of turfgrass next to stream or pond edges. For strategies to manage Canada geese check out the RCE fact sheet at njaes.rutgers.edu/fs1217/. And for native plants that have deer resistance, you can view the RCE fact sheet with ideas at njaes.rutgers.edu/fs1353/.
RESOURCES
EPA’s National Rivers and Streams Assessment (NRSA) report. riverstreamassessment.epa.gov/webreport/
‘Exploring Your Watershed from Home’ webinar by Dr. Sal Mangiafico. www.youtube.com/watch?v=vkXHKI7uWDA&list=PLKx8NLAujm_lpOimXWyHxPD613H7HjZKd&index=18
EPA’s How’s My Waterway? website. www.epa.gov/waterdata/hows-my-waterway
Rutgers University’s Soil Testing Laboratory. njaes.rutgers.edu/soil-testing-lab/
Rutgers ProFACT Program. profact.rutgers.edu/
Jersey-Friendly Yards plant database. www.jerseyyards.org/plant/
Rutgers Cooperative Extension County offices. njaes.rutgers.edu/county/
‘Strategies for Resident Canada Goose Control and Management in New Jersey’ fact sheet. njaes.rutgers.edu/fs1217/
‘Invasive Plants and Native Alternatives for Landscapes’ fact sheet. njaes.rutgers.edu/fs1353/