Main Content
Scientific Data to Help Plan Your Outdoor Activities
By: Douglas Zemeckis (County Agent II/Associate Professor)
The summer season is in full swing at the Jersey Shore. To help escape the summer heat and to have some fun in the sun, you might be planning to do some outdoors activities such as swimming or fishing. Before heading to your favorite shore locations, there are some helpful science-based resources to access oceanographic or meteorological data that will help you with planning. The following are some valuable resources to check out to know what to expect at locations along the Jersey Shore. This newsletter is part of a series of educational newsletters for our Earth Day Every Day program through Rutgers Cooperative Extension, which also consists of educational webinars hosted since 2020 to cover a wide range of environmental issues in New Jersey.
Water Temperature
The temperature of the surface ocean water is influenced by many factors, such as the winds, tides, and amount of sunlight. Even on the warmest of summer days, the water can be quite cold due to coastal upwelling where cold, deep water is pushed up onto the beaches. Therefore, it is helpful to check data about water temperatures before heading out so you know what to expect.
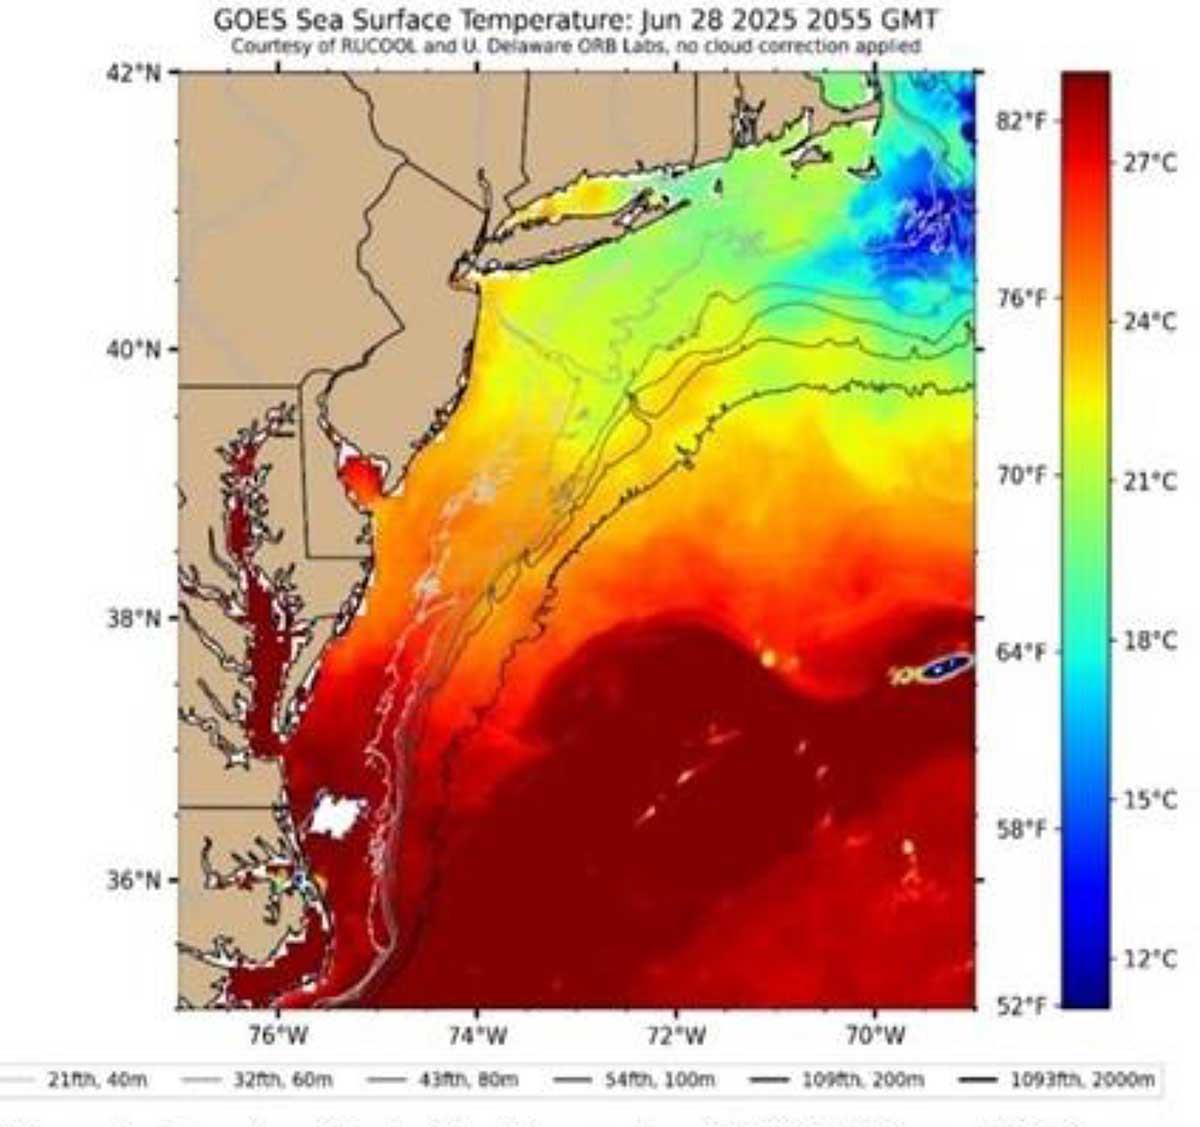
Fortunately, oceanographers from the Rutgers University Center for Ocean Observing Leadership (RUCOOL) study many aspects of our coastal ocean and make this information publicly available for free, including temperature data of surface waters as measured using satellites and autonomous underwater vehicles (AUVs) called gliders.
These Sea Surface Temperature (SST) data can be visualized for the whole Jersey Shore in Satellite Imagery available on RUCOOL’s website. The temperature data are available for many regions, but selecting the Mid-Atlantic Bight region from the dropdown menu helps to show the whole Jersey Shore, including large bays such as Raritan Bay and Delaware Bay (Figure 1). Given that these data are collected by satellites that cannot see through clouds, the sea surface temperature data are only available on days and for locations without cloud cover. If you need help reading these maps of sea surface temperature, or if you want to learn some more about the oceanography off our coast, you can visit this resource from RUCOOL on How to Read a Sea Surface Temperature Map.
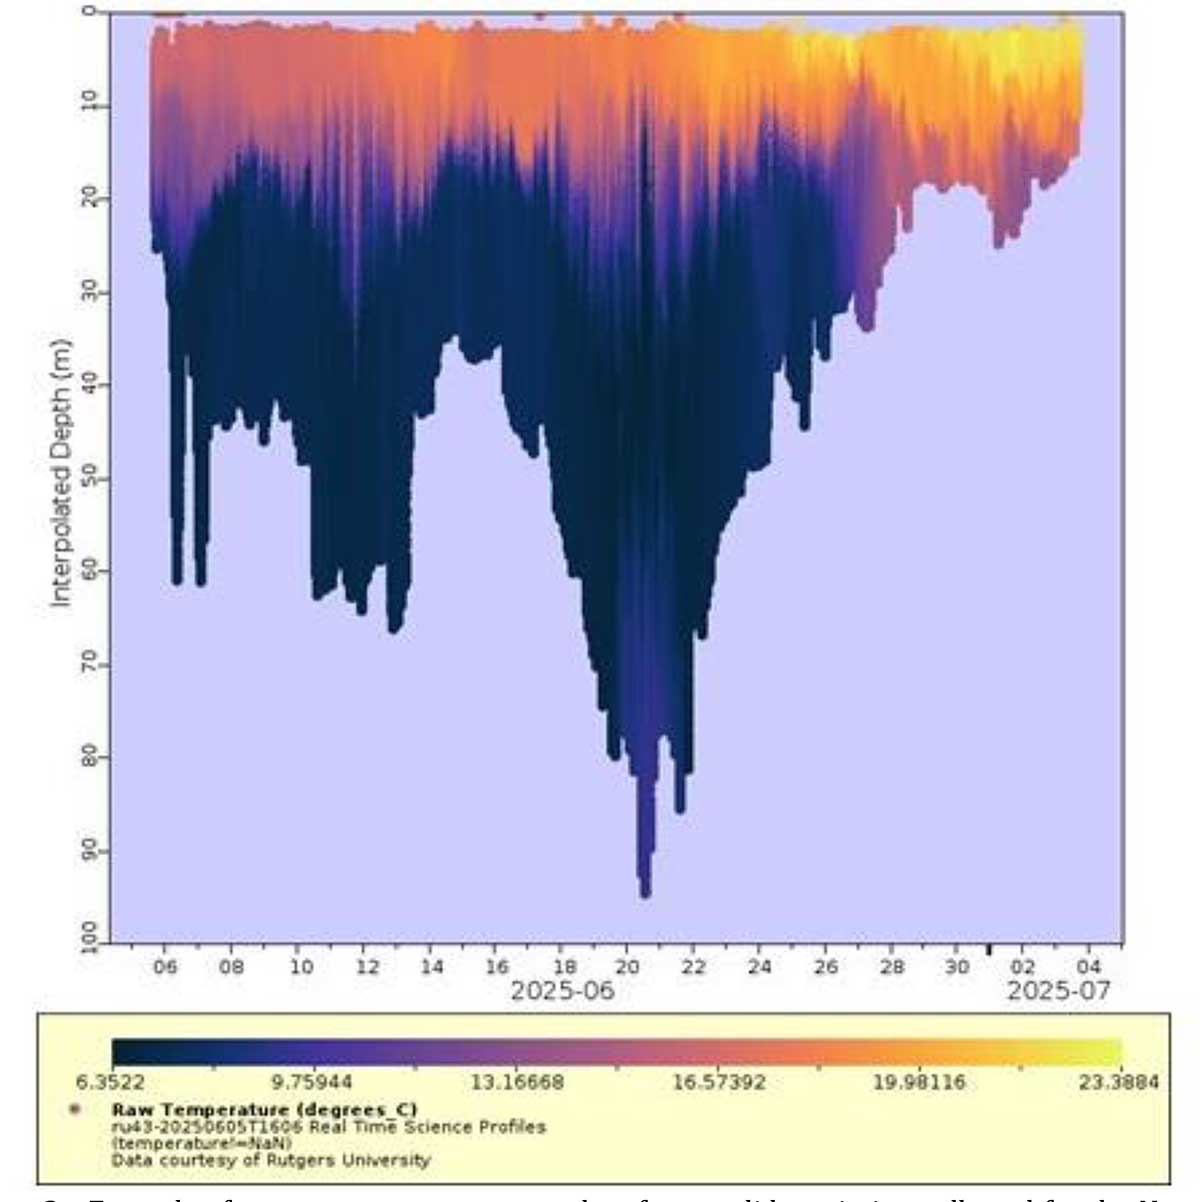
The gliders are like underwater robots that are deployed into the ocean and “fly” underwater in a see-saw pattern from the surface to near the seafloor. Check out our February 2024 newsletter entitled “Using Underwater Robots to Study the Ocean” to learn more about gliders. The gliders take measurements from the surface to the ocean bottom, measuring many variables including ocean temperature (Figure 2), salinity, dissolved oxygen concentration, pH (a measure of ocean acidity), and concentrations of single-celled plants (i.e., phytoplankton, the base of the ocean food web). They also can carry sensors that detect the presence of marine mammals and tagged fish. These data can be viewed in real-time during the glider missions on the RUCOOL glider map website by clicking on the ‘Deployment’ links available for each actively deployed glider. The images will show vertical (i.e., from the ocean surface to the seafloor) cross-sections of each variable over time.
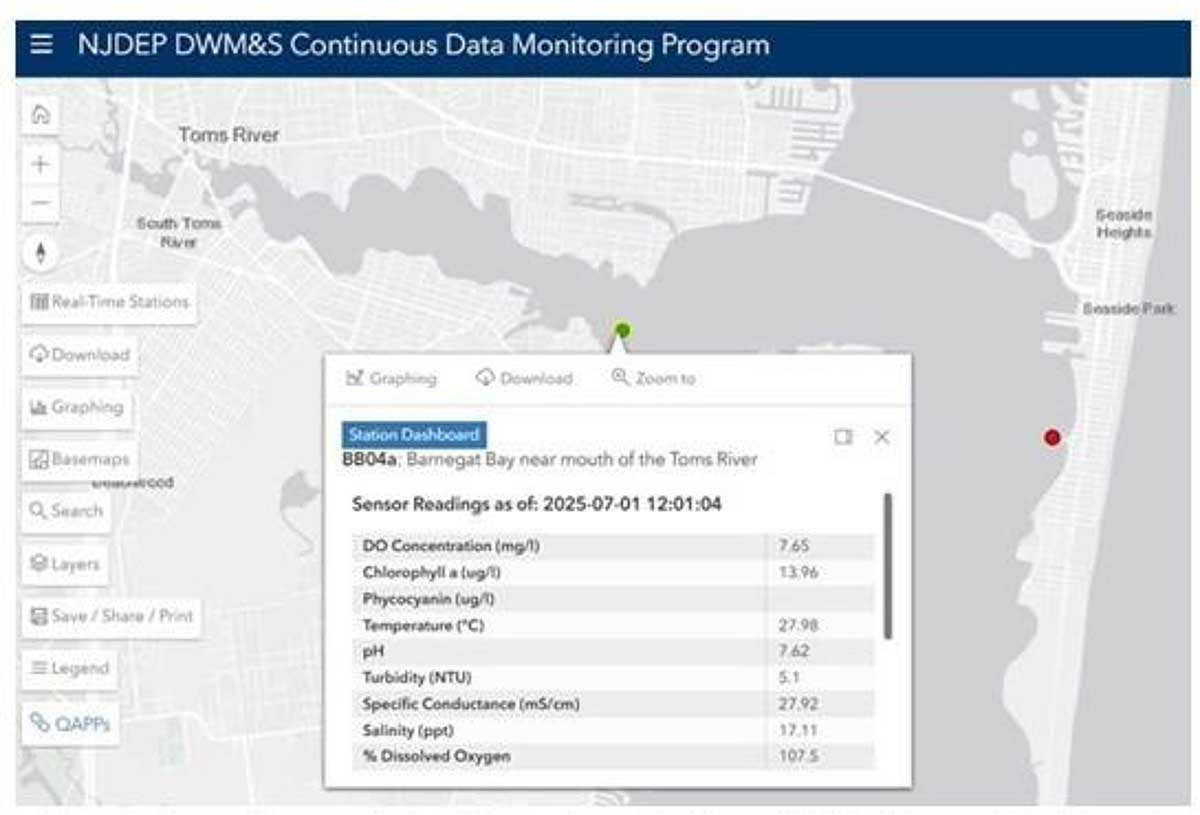
The Bureau of Marine Water Monitoring (BMWM) is a part of the New Jersey Department of Environmental Protection (NJDEP) and they work to evaluate New Jersey’s coastal water quality to ensure the safe consumption of shellfish and to identify potential pollution sources to protect public and ecological health. The BMWM’s Continuous Data Monitoring Program includes a network of water quality sensors that monitor water temperature, as well as many other parameters such as salinity, dissolved oxygen, and pH. Data from this program can be accessed on their program’s website to obtain real-time and historical water quality data. Currently active locations are focused on Barnegat Bay, including the Metedeconk River, Toms River (Figure 3), Oyster Creek Channel, Manahawkin Bay, and further south to Little Egg Harbor Inlet.
Beach Water Quality Data
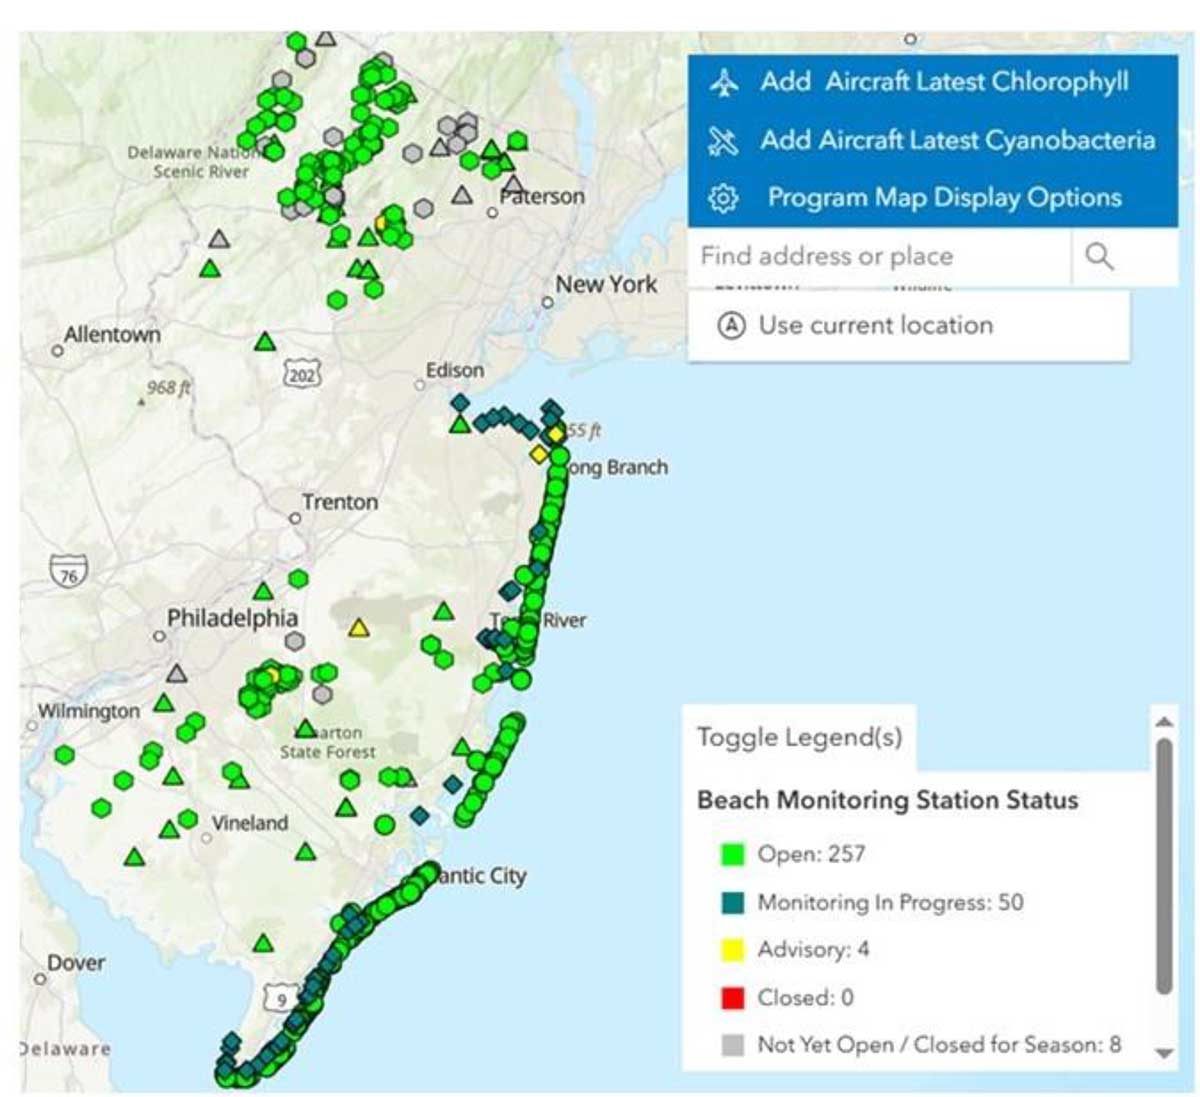
There are several programs to monitor water quality of coastal nearshore waters at public recreational bathing beaches, which helps to maintain public health and safety while visiting the Jersey Shore. These programs include the Cooperative Coastal Monitoring Program (CCMP), which is a collaboration between the NJDEP Beach Monitoring Program, NJ Department of Health, and local health authorities.
The primary recreational water quality standard in New Jersey’s marine waters is determined by the concentration of indicator bacteria (Enterococci). If an initial sample exceeds the water quality standard, the local health authority issues a swimming advisory at the bathing beach where the sample was collected to warn the public of potentially unhealthy conditions. Beach closures for swimming are implemented if two consecutive samples exceed the water quality standard, or in other circumstances such as washups of debris/trash or after certain rainfall amounts.
You can check the monitoring station status of beaches throughout New Jersey, as well as learn more about the CCMP and other associated programs, by searching the map on the NJDEP Beach Monitoring Program homepage (Figure 4).
Weather Forecast Data
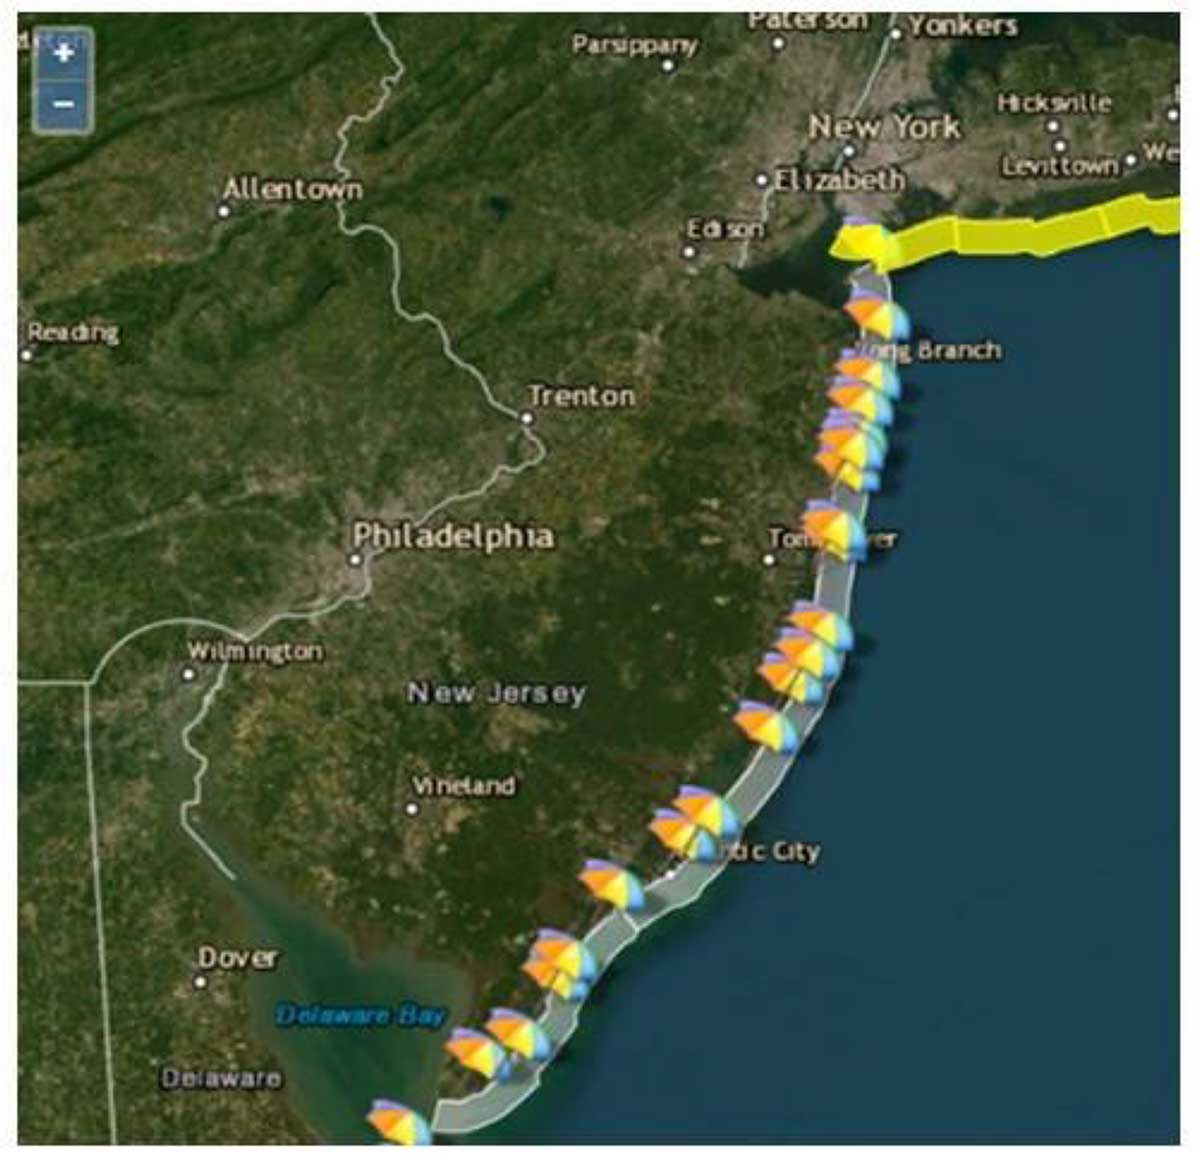
The National Weather Service, which is a part of the National Oceanic and Atmospheric Administration (NOAA), has beach forecast information for popular locations all along the Jersey Shore (Figure 5). These forecasts include weather (air temperature, precipitation, wind), ocean water temperature, rip currents risk, and UV index information that will help you to be prepared.
If you are heading out on a boat, it is always a good idea to check out the marine weather forecast to get an idea of the wind, waves, and sea conditions predicted offshore to help provide for safe navigation. Check out the marine weather forecast for different zones off our coast from the National Weather Service.
Tidal Data
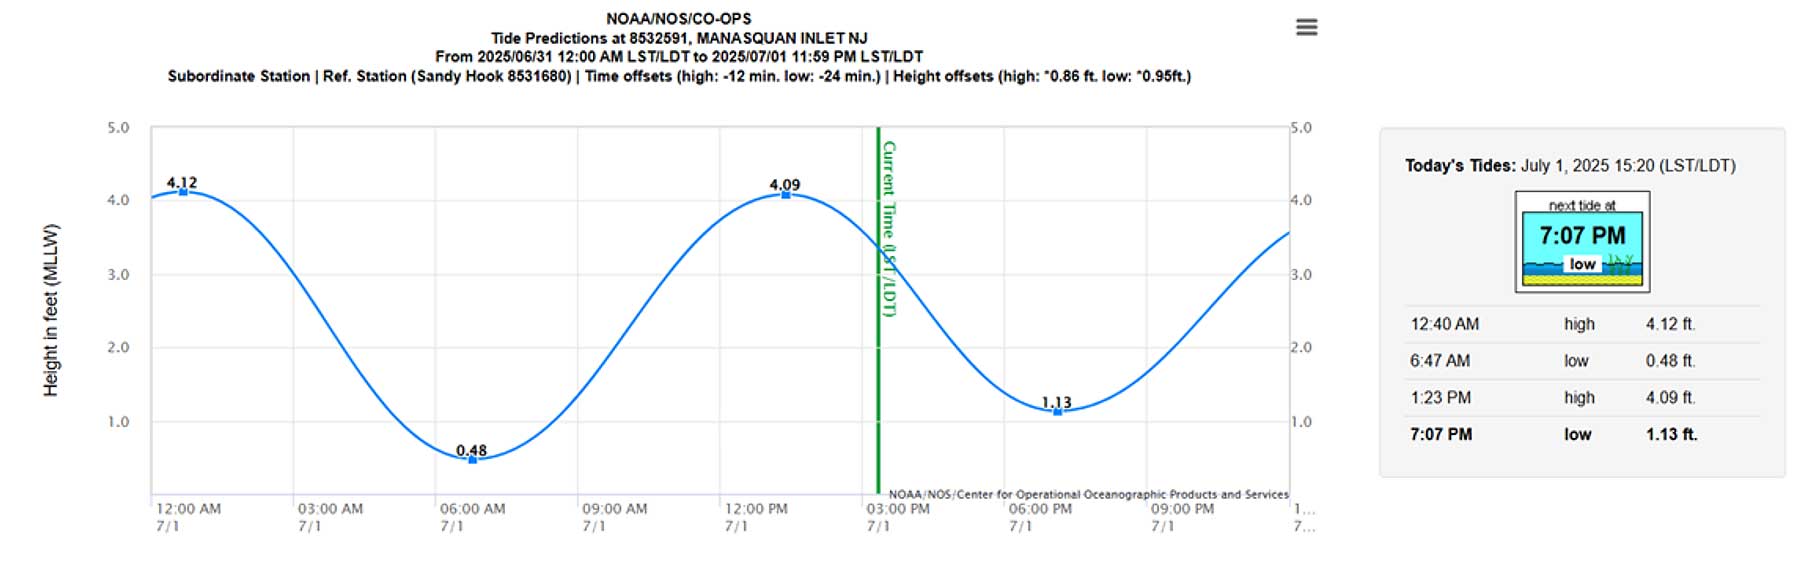
If you have ever been to the beach at the Jersey Shore (or elsewhere in the world), you are probably familiar with the difference between high tide and low tide (learn more about tides from this resource by NOAA). Whether it is high or low tide can impact your experience while swimming or fishing at ocean or bay beaches, and the stage of the tide can also impact your access to many different areas along the coast. It is helpful to check out information about the timing and amplitude of the tides whenever you head out so that you can plan your activities. The following is a valuable resource with tide predictions for many areas along the New Jersey coast as made available through NOAA. An example is shown in Figure 6 for the Manasquan Inlet in Point Pleasant Beach.
Discussion
Checking these resources before you head outside at the Jersey Shore will help you to plan for your fun in the sun. Be prepared and be informed to enjoy the wonderful beaches and coastal waterways of our Garden State. What will the waters be like? Will I need sunscreen? Is it a good day to swim and surf? The oceanographic and meteorological data in these resources will help to answer these questions and more!